Usage note: To see some preset views, click 'view'
arrows below the 3D picture.
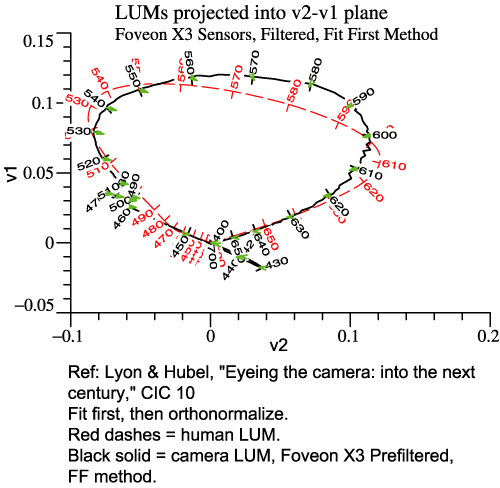
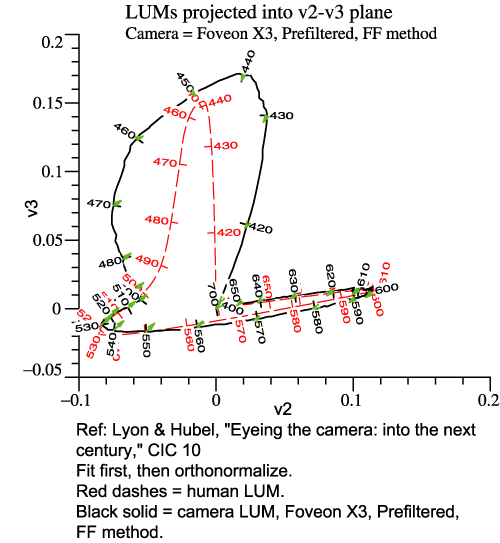
In the virtual reality picture above, the Locus of Unit Monochromats
for the human 2°
observer is drawn in the usual way, as the edge of the multicolored
surface. The LUM of the camera is indicated by spheres. The short
arrows indicate the transition from the camera's LUM itself to the best
fit, so the arrow tips are the best fit curve. If the spheres lay right
along the human LUM, that would mean that the camera fulfills
Maxwell-Ives. In that case, the camera's LUM would be the best fit, and the arrows
would have zero length.
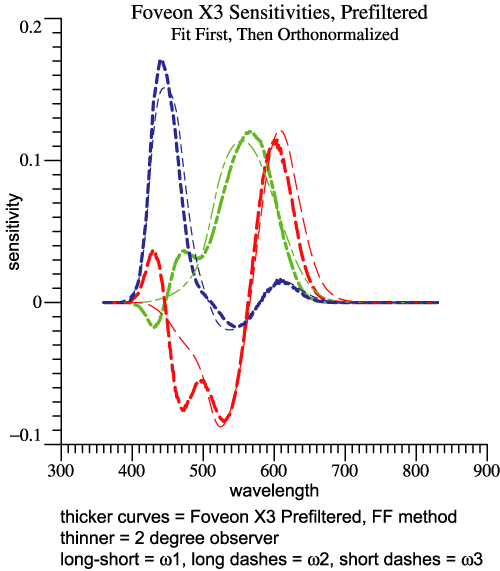
The camera LUM is derived by the "fit first" steps:
- Find a best fit to human LUM by a linear combination of the
camera's sensor functions. The best fit functions will look more or
less like achromatic, red-green, blue-yellow, but will not be an
orthnormal set.
- Preserving that sequence, orthonormalize the functions by
the Gram-Schmidt method .
- Combining those 3 functions into a 3-dimensional graph
gives the camera LUM, indicated by spheres.
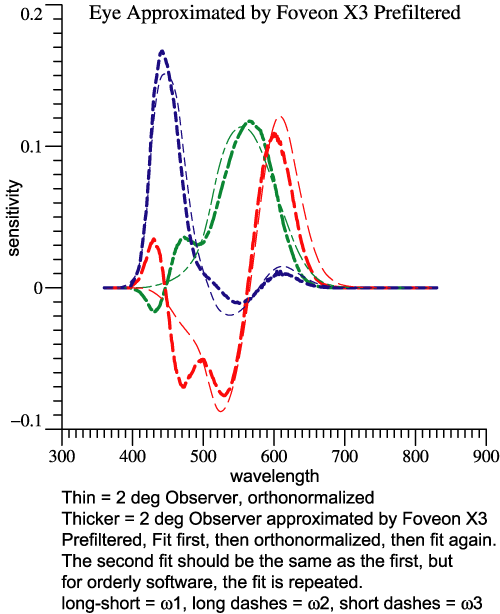
- Yes, the best fit found as an intermediate step is the same
best fit indicated by the tips of the short arrows.
The steps just specified all result in adding and subtracting of the
camera sensor functions. We can then ask if the red-green function is
really made by subtracting the camera's green function from its red
function, and so forth. Such questions are answered by the
transformation matrix relating the camera's orthonormal basis to the
sensor functions. Let the camera sensors be
the columns of array rgbSens, and CamOmega be the camera's orthonormal
basis. Then
CamOmega = rgbSens*Y, where
Y = inv(CamOmega'*rgbSens) .
The tiny apostrophe, ', denotes matrix transpose. The transform Y can
be found for any camera, and indeed for the eye itself.
2°
observer himself
|
Foveon
X3,
no filter
|
Prefiltered
Foveon X3
|
Y =
inv(OrthoBasis'*rgbbar) =
0.0725
|
0.267 |
0.0376 |
| 0.0447 |
-0.310 |
-0.0543 |
0
|
0
|
0.138 |
|
Y = inv(CamOmega'*rgbSens)
=
| 0.962 |
5.56 |
1.919
|
| 2.41 |
-6.98 |
-5.72 |
| -0.783 |
1.61 |
5.84 |
|
Y = inv(CamOmega'*rgbSens)
=
| -0.544 |
9.40 |
2.67
|
| 5.61 |
-13.1 |
-7.86
|
| -1.72 |
3.56 |
7.99 |
|
Column amplitudes =
0.0852
0.409 0.153
|
Column amplitudes =
2.71
9.06 8.40
|
Column amplitudes =
5.89
16.5 11.5
|
|
